
**We have updated the content in this blog! Check it out here!
Today’s post will be short, sweet and to the point.
I was doing client research into the typical backer profiles and came across some interesting and perhaps powerful statistics on the nature of crowdfunding. I thought it could be beneficial for the community so let’s look a little deeper into the backer demographics of Kickstarter and Indiegogo.
Just maybe these mathematical mysteries will help entrepreneurs out there launch better businesses and understand their target crowdfunding customer segments just a bit better.
Numbers Never Lie(???)
One of the main advantages entrepreneurs of today have over those of the past is data. Where once startups relied on intuition and incredibly limited customer surveys, the advent of the internet, big data and split testing are taking entire industries by storm.
That is great news for entrepreneurs everywhere, but it can be overwhelming. When contemplating mountains of data, the road forward is often anything but clear.
The Big Picture
Honestly I’ve always found it challenging to overcome the noise and instead look at the bigger picture. That’s a major motivator of this post.
The Art of the Kickstart community has been rapidly growing, evolving and gaining momentum in the crowdfunding space. I’ve heard two heads are always better than one so let’s put that to the test. I’ll present the findings, my intrepretations and then see what other smart startup oriented individuals infer. Together just maybe we can make sense of all this crowdfunding data and uncover a couple tidbits to take our campaigns to the next level.
Crowdfunding Demographics
When analyzing stats it’s always important to preface them with sources and context. Everything you see here on crowdfunding customer demographics comes directly from Quantcast, arguably the most reputable of the online statistics companies. Also keep in mind the stats shown are only for US-based users.
While unfortunate and somewhat limited in scope, the US still makes up more than half of all crowdfunders and allows for pretty important trends to be seen. Note: IGG will always remain on the left with Kickstarter on the right.
Gender
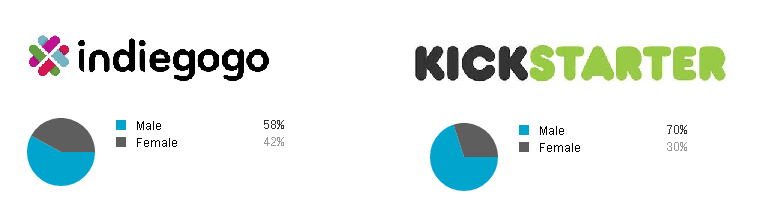
Wow! Just wow. I never imagined the incredible chasm which separated Kickstarter and Indiegogo audiences was so substantial.
This speaks to just how unique each of the juggernauts of crowdfunding truly are and cannot be ignored. Note: I’ve seen stats suggesting as high at 78% of Kickstarter visitors are in fact male, well above the internet average, and of course this plays a prominent role in strategizing your crowdfunding project.
While it’s not as black and white as Kickstarter for guy products and IGG for the ladies, truthfully it seems smart to consider: who exactly is your ideal customer?
Age
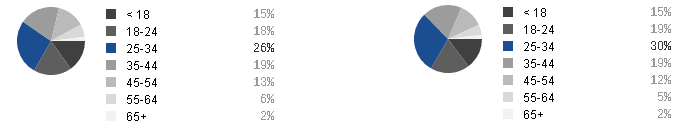
Interestingly it appears Indiegogo appeals to a slightly older demographic of users. While I’m unsure how significant the stats are, at scale it’s important to consider. What age range and ideal customer are your targeting? Age almost always plays an enormous role in the audiences you’re attempting to reach.
Education and Income
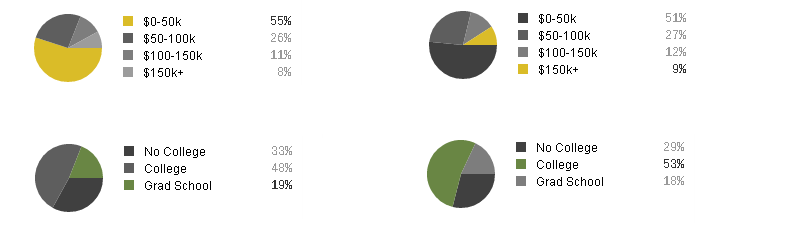
While the age statistics seemed relatively insubstantial, when paired with the income and education levels of both Kickstarter and IGG backers, the picture takes on a new light.
Kickstarter backers are younger, better educated and more financially successful than their Indiegogo counterparts. This is incredible important. Though Kickstarter visitors are younger they’re earning more and earlier in their careers than IGG audiences. Though differing in only relatively small proportions, this would suggest a stronger, more meaningful trend.
I’d hypothesize the Kickstarter crowd is more ingrained in up-and-coming, higher-salaried industries and almost assuredly more tech-oriented than their crowdfunding cousins of Indiegogo. This is further evidenced by the greater successes of next-gen tech startups on Kickstarter as opposed to IGG.
Mobile Users
This is the most powerful and shocking of all! Honestly the entire article was inspired by this incomprehensible stat.
At this point it’s evident mobile usage is taking off across the world. More and more individuals and customers are browsing the web via sophisticated and ever-improving smartphones. Yet even as mobile internet usage accelerates, anyone involved in ecommerce, internet marketing or online entrepreneurship understands the issues of mobile.
From lower conversion rates, responsive design challenges and less screen space it seems like an increasingly annoying problem. Well, the stats speak for themselves. This beyond significant statistic would suggest significantly reduced conversion and engagement rates with Indiegogo campaigns compared to Kickstarter.
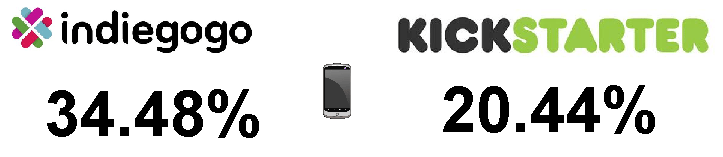
As you can see, a much greater percentage of IGG users are accessing the site on the go. Any theories on the vast differences? This is particularly perplexing, and better understanding the backer behavior could be critical in not only deciding on a platform, but in conceptualizing how your campaign is displayed.
Moral of the math: If you build your business around IGG, ensure your images, campaign page and copywriting are effective on all screen sizes.
Final Thoughts
So there they are. What do you guys think? I’d love to hear your opinions on the article, the stats and of course the conclusions I drew.
Though I’d love to claim expertise, this isn’t exactly in my repertoire so I’d love to get some other educated opinions. Maybe as a team we can unravel some of the secrets to crowdfunding success…what do you say?
Numbers never tell the entire story…


Good article, and lots of good points. On the mobile front, Kickstarter’s mobile app works pretty well on iOS. Each project is easy to see on an iPhone. IGG promotes its app much more aggressively than KS, and maybe that’s the difference.
Thanks for sharing these statistical insights. The numbers tell as story and as the article mentions data driven management decisions are a great advantage of operating in the digital age. The increased data must be analyzed and integrated into all of the business decisions in the crowdfunding space. Again thanks for the insightful article.
Glad you liked it Bill. Coming from you, a killer in crowdfunding that means a lot.
Great information! My guess about the smartphone traffic: because IGG backers have lower income, more of them use public transportation to get around. So, they visit the website during the commute time. It is much more difficult (and dangerous) to do while driving a car.
Regarding the ratio of male to female backers on Indiegogo, even though Indiegogo has a higher ratio of female backers, Kickstarter has a significantly higher traffic of backers overall. So wouldn’t Kickstarters 30% female ratio still be higher in number compared to Indiegogo ‘s 42% female ratio? And if Kickstarters demographic is a higher earning income bracket than for those campaigns that have a higher priced product wouldn’t Kickstarter be a more appealing crowdfunding platform to host the campaign on?
There would be more female backers going through Kickstarter because of the traffic. The demographics are different from site to site, but you’re still getting a lot more to review your campaign. I didn’t know about the responsive challenges, that’s something to consider in terms of people viewing the sites on mobile.
Business Developer at Thrinacia White Label Crowdfunding
Great stats, with lots of learnings. However, I would like to understand a bit more about the motivation behind those visiting the sites. For example, are they investors, entrepreneurs, early adopters as this provides some input into WHY they hope to back your idea. Do they believe in the investment opportunity or does the solution men something to them personally
Great Question by the way. The motivation is getting the product in exchange of the fund. These are Pre-ordering sites. Go and browse these sites and you will understand. It does not seem so from outside because they are project centric. It seems to appeal for fund for creative projects, but the backers are getting the product in exchange. Definitely they are early adapters and geeks. Not everybody will try to use smart and connected products. There is real motivation in following upcoming trends. More over, backers get at 20% to 50% discount as an early bird. So there is a huge upside in following these trends. Trust me once you order these creative products, people surrounding you will get inspired by the way you live. You will be a leader in your society. People will ask for your review for any upcoming products. But at the end you should also be inspired by the products sellers create.
[…] demographics: Understand Kickstarter and Indiegogo backers (2014) Available at: https://artofthekickstart.com/crowdfunding-demographics-understand-kickstarter-and-indiegogo-backers/…: 3 November […]
[…] demographics: Understand Kickstarter and Indiegogo backers (2014) Available at: https://artofthekickstart.com/crowdfunding-demographics-understand-kickstarter-and-indiegogo-backers/ (Accessed: 6 November […]
[…] demographics: Understand Kickstarter and Indiegogo backers(2014) Available at: https://artofthekickstart.com/crowdfunding-demographics-understand-kickstarter-and-indiegogo-backers/ (Accessed: 6 November […]
[…] (2014) Crowdfunding demographics: Understand Kickstarter and Indiegogo backers. Available at: https://artofthekickstart.com/crowdfunding-demographics-understand-kickstarter-and-indiegogo-backers/ (Accessed: 18 November […]
[…] in the presentations of either company. For the differences between their audiences, read this. For a comparison of the two for those looking to raise project finance, […]
How did you come by this data from Quantcast? I clicked on the link and it took me to the home page, and did a search on Kickstarter and only traffic information was available.
Thanks!
[…] D.R. (2014) Crowdfunding demographics: Understand Kickstarter and Indiegogo backers. Available at: https://artofthekickstart.com/crowdfunding-demographics-understand-kickstarter-and-indiegogo-backers/ (Accessed: 7 December 2016). O’Neil-Hart, C. (2016) How online video influences your audience. […]
[…] https://artofthekickstart.com/crowdfunding-demographics-understand-kickstarter-and-indiegogo-backers/ – Crowdfunding Demographics: Understand Kickstarter and Indiegogo Backers, by Matt Ward. Last Accessed on 16/12/16 […]
[…] demographics: Understand Kickstarter and Indiegogo backers(2014) Available at: https://artofthekickstart.com/crowdfunding-demographics-understand-kickstarter-and-indiegogo-backers/ (Accessed: 6 November […]
[…] are. For example, did you know roughly 78% of Kickstarter visitors are male? That’s what artkick.wpengine.com‘s article […]
[…] demographics: Understand Kickstarter and Indiegogo backers (2014) Available at: https://artofthekickstart.com/crowdfunding-demographics-understand-kickstarter-and-indiegogo-backers/ (Accessed: 8 January […]
[…] https://artofthekickstart.com/crowdfunding-demographics-understand-kickstarter-and-indiegogo-backers/ […]
[…] (2014) Crowdfunding demographics: Understand Kickstarter and Indiegogo backers. Available at: https://artofthekickstart.com/crowdfunding-demographics-understand-kickstarter-and-indiegogo-backers/ (Accessed: 7 February […]
Really love all the information here. Overall great article. My main concern/question is- where exactly did these numbers come from and where are the citations?
[…] diverse than Kickstarter. For projects and apps targeting female users, this is important to note. Research indicates26 only about 22–30% of Kickstarter users are female as opposed to 42–50% for IGG. Apps or […]
[…] diverse than Kickstarter. For projects and apps targeting female users, this is important to note. Research indicates only about 22–30% of Kickstarter users are female as opposed to 42–50% for IGG. Apps or […]